About this project
Hi! I'm Kabir Moghe, and I created this application to provide granular information about the spread and local impact of COVID-19. The app allows users to understand the current situation of the pandemic within their county, understand vaccination data, and explore the relationship between various county attributes and COVID-19 data.
References
The self-updating data set compiles data from the sources below:
- Cumulative COVID-19 Case and Death Tallies: USAFacts
- Vaccinations: CDC
- Mask/Social-Distancing Policies: AARP
- Race Demographics: US Census Bureau
- Unemployment, Income, and Education: USDA
- Calculated Population Density: USAFacts and ArcGIS
Note: many data providers like the CDC have stopped regularly collecting/publishing county-level data given that 3+ years have passed since the pandemic's onset, so information provided will be as recent as possible (based on the recency of source data) but may not be up-to-date.
Methodology
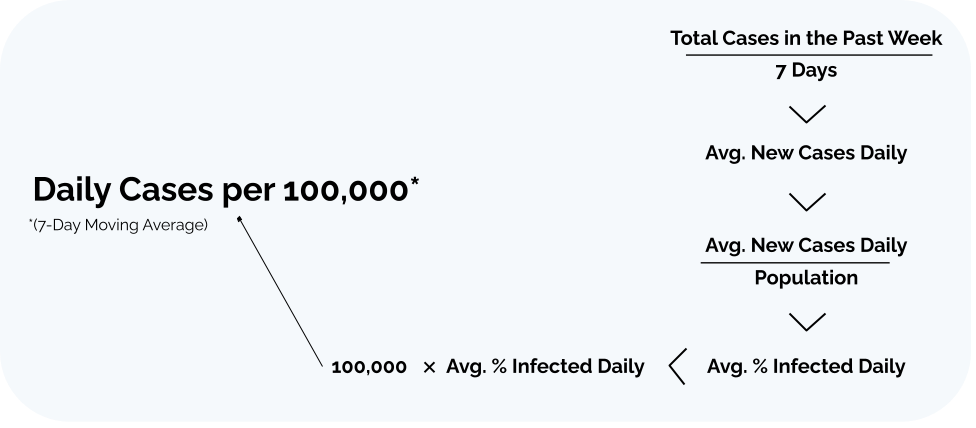
In order to determine the risk of infection in a certain county, the 7-Day moving average was used, which is the average number of new cases each day over the past week per 100,000 people (calculation shown above). Since county-wide population varies, 100,000 is a commonly used number to have normalized rates across all counties, so simple percentages are scaled to a number of cases out of 100,000.

To calculate risk from the moving average, the methods from the Harvard Global Health Institute were used. Specifically, as shown by the key above, low risk (green) is determined as less than 1 new case per day, moderately low risk (yellow) as 1 or more but less than 10 new cases per day, moderately high risk (orange) as 10 or more but less than 25 new cases per day, and high risk (red) as 25 or more new cases per day (all according to the 7-day moving average).
Other Notes
Click here to learn about some analysis I performed in August 2020 using the data from then.
The code for this web app can also be accessed here.
Contact me using links below with any questions, and if you have any feedback or issues, feel free to leave it in the form below. Thanks!